Wednesday, January 21, 2009

MORE (Market Opportunities and Risks Evaluation)

.
Understanding the attractiveness of a market vis-à-vis others has always been of paramount strategic importance to everyone – be it a large multinational giant, a small start-up or a PE/VC firm looking to capture a market opportunity pie.
.
From an individual entity’s standpoint, frameworks and models such as the SWOT Analysis, Boston Consulting Group’s Growth-Share Matrix, McKinsey’ Industry Attractiveness-Business Strength Matrix and Porter’s Five Forces have always served the need. However, considering the fact that that most of these frameworks look at the External Operating Environment (EOE) from a particular entity’s standpoint, a neutral judgment of a market vis-à-vis another market, irrespective of who is judging it, becomes extremely difficult.
.
A PEST (Political, Economic, Sociological, and Technological) analysis, to some extent, attempts to solve this dilemma by listing the attributes that characterize a market. However, a PEST analysis looks at a market with a macro perspective and thus doesn’t necessarily segregate multiple markets on the basis of their PEST attributes.
.
Several modifications to the existing frameworks and models have been attempted to tackle this issue and to provide an independent bird’s eye view of the comparative attractiveness of different markets – the notable of which are the “SWOT Analysis of Market(s)” and the “External Factor Evaluation (EFE)”.
  • SWOT analyses are ideally performed on companies and not on markets, the justification for which is very simple. In case of companies there is a clear demarcation of the boundary that differentiates the internal factors (Strengths, Weaknesses) from the ones in the External Operating Environment (Opportunities, Threats). In a market however, there is no clear definition of an External Operating Environment and thus is hard to distinguish the strengths from the opportunities and the weaknesses from the threats.
  • External Factor Evaluation (EFE), on the other hand, comes very close to tackling the issue by identifying and quantifying the EOE factors that shape and characterize the market(s), a company operates in. However, the fact remains that EFE Analyses are never performed in isolation and always follow, what is called the Internal Factor Evaluation (IFE) – the end objective being to build the Internal-External (IE) Matrix. And hence, the bias remains.

Essentially, the trick is to build a framework that does an Internal Factor Evaluation (IFE) by considering the markets as individual entities. In other words, it’s an IFE, independent of the influence of an External Operating Environment (EOE). Here I propose, what I call, MORE (Market Opportunities and Risks Evaluation).

MORE (Market Opportunities and Risks Evaluation):
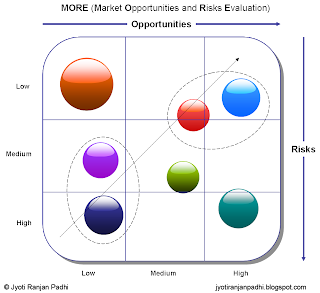
MORE is a qualitative attribute based study that takes into account all the factors (Opportunities and Risks) that shape and characterize a market. Examples of market opportunities could be:

  • Ease of market entry/exit
  • High market growth forecasts
  • High consumer demand forecasts
  • Early stage of the industry in the evolutionary life-cycle

Examples of risks could be:

  • Fragmented market and thus chances of loosing out to competition
  • Recession sensitive – the ongoing recession might lower the spending
  • Increasing demand for price reduction
  • Non-reimbursable and hence sensitive to macro-economic scenario such as inflation
  • Highly sensitive to technological changes

The first step in building a “MORE Matrix” involves listing out the opportunities and risks for all the markets for which a comparative attractiveness analysis is being done. The second step involves weighing the opportunities and risks independently on the basis of their relative importance to the market. The weights are then multiplied with an Impact Factor. The Impact Factor is basically a score, in a scale of 1 to 5, which measures the strength and likelihood of the opportunity/risk. What comes out of all these is a score specific to each MORE attribute (Opportunities and Risks) of a market. The opportunities and risks scores are then averaged out independently to assign a consolidated Opportunity and Risk score to each market. The scores are then plotted (Opportunities in Y-Axis and Risks in X-Axis) in a 2x2 matrix to measure and visualize the relative attractiveness of the different markets being studied.

Since the matrix, at no point, takes any particular company into consideration, it almost succeeds in delivering a neutral judgment of a market vis-à-vis another market, irrespective of who is judging it.
Friday, January 9, 2009

Satyam Computer Services: India's Enron

April 21, 2008

Fiscal 2008 was an outstanding year for Satyam. We achieved record revenues and record net income.

Source: 21st Annual Report 2007-08, Satyam Computer Services Limited

January 7, 2009

Dear Board Members,

It is with deep regret, and tremendous burden that I am carrying on my conscience, that I would like to bring the following facts to your notice:

  1. The Balance Sheet carries as of September 30, 2008
    Inflated (non-existent) cash and bank balances of Rs.5,040 crore (as against Rs. 5361 crore reflected in the books)
    An accrued interest of Rs. 376 crore which is non-existent
    An understated liability of Rs. 1,230 crore on account of funds arranged by me
    An over stated debtors position of Rs. 490 crore (as against Rs. 2651 reflected in the books)
  2. For the September quarter (Q2) we reported a revenue of Rs.2,700 crore and an operating margin of Rs. 649 crore (24% Of revenues) as against the actual revenues of Rs. 2,112 crore and an actual operating margin of Rs. 61 Crore (3% of revenues). This has resulted in artificial cash and bank balances going up by Rs. 588 crore in Q2 alone.

Source: Letter to the board of directors of Satyam Computer Services Ltd.

It’s hard to believe that the aforementioned are the wordings of Mr. B. Ramalinga Raju, the founder and ex-Chairman of Satyam, India’s fourth largest IT services company. What a contrast – unbelievably a sad chapter in India’s IT story.

Everyone is hurt and so am I. To me, Mr. Raju was Satyam, personified but is he the only one to blame. True, he hurt investors. True, he cheated the people who contributed in making Satyam what it is today. But, is he the only one? What about the other directors? What about PricewaterhouseCoppers, the accounting giant? What about SEBI? What about the stock exchanges? There are many more questions that need to be answered. Surely, there is much more than what meets the eye.